What NBA matchup tracking actually records
NBA matchup tracking records which defender was nearest a scorer and what happened during that stretch. It does not record the defensive scheme, the help behind the play, or whose responsibility the possession was. Because assignment is by proximity, a defender is credited with whatever shot the offence generated near him, which is why the data describes association rather than cause, and why rim protectors and perimeter defenders cannot be compared on it directly.
6 min read · Data as of 7 June 2026 · Analysis 27 July 2026
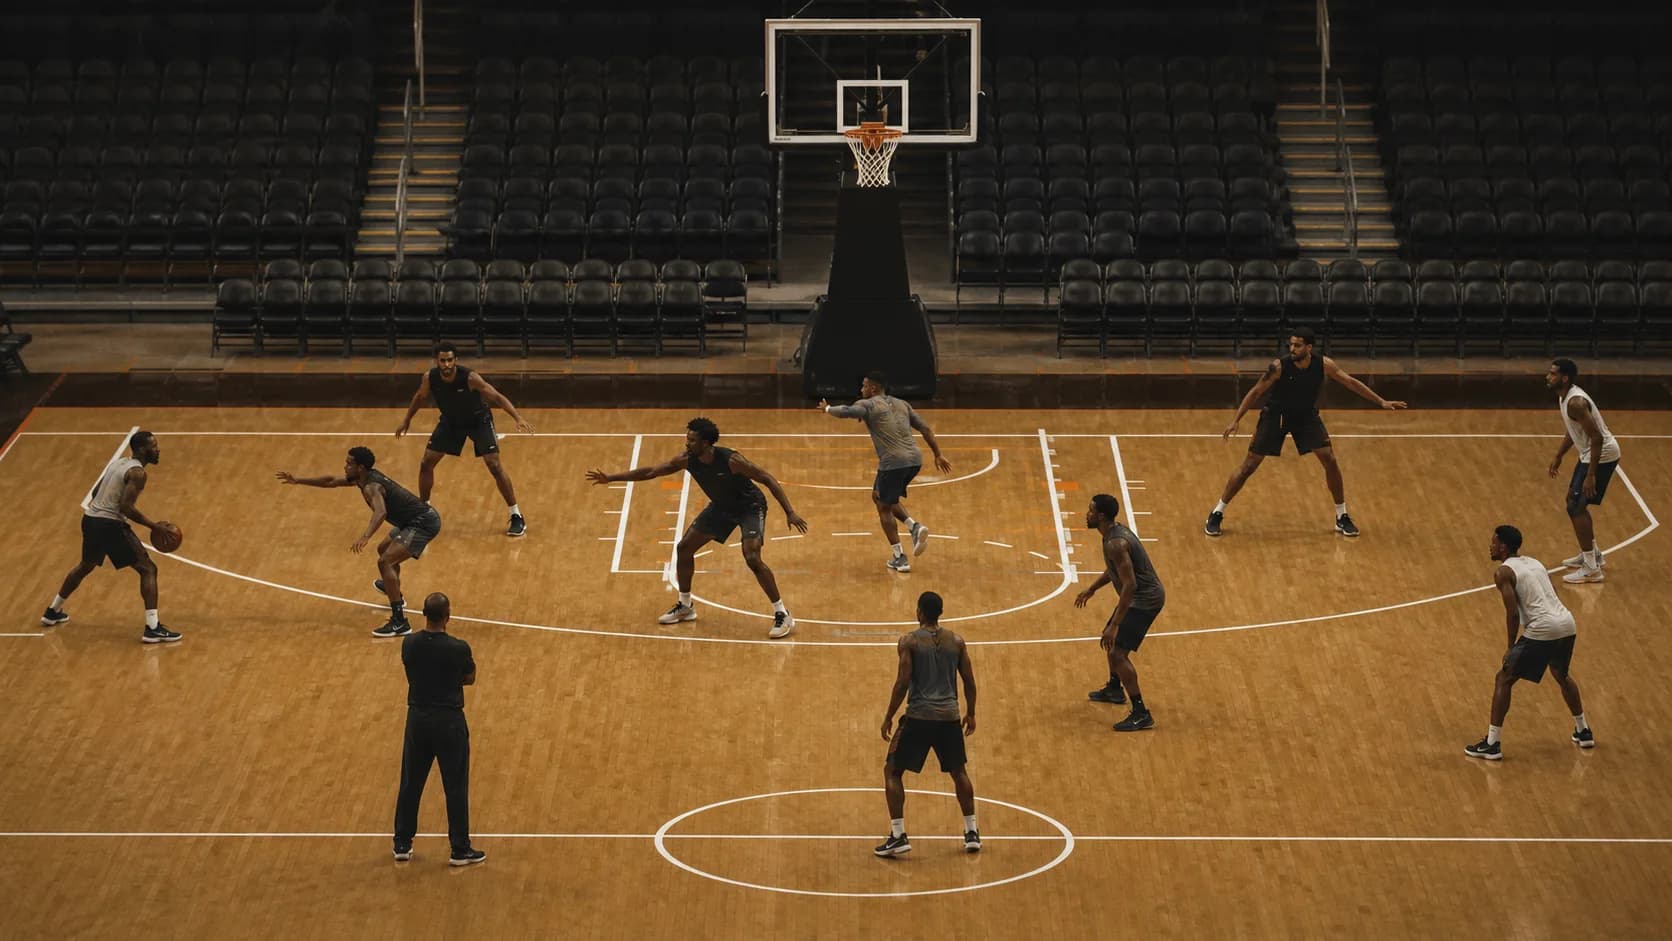
What the feed contains
Each row pairs one scorer with one defender in one game and carries the possessions they were matched, the points the scorer produced, his shots made and attempted, turnovers, and fouls. Across the loaded season that is 24,974 rows, averaging 7.24 matchup possessions per row.
That is a genuinely useful record, and it is worth being precise about its edges, because most bad conclusions drawn from matchup data come from assuming it contains something it does not.
Assignment is proximity, not responsibility
The defender on a row is the one tracking judged to be matched, which in practice means nearest and oriented toward the ball handler. Basketball does not work that way. On a pick and roll the nominal defender may be trailing by design while the responsibility sits with the big man in drop coverage. On a drive the closest defender at the finish is often the help, not the man beaten.
The data cannot see any of that. It records who was there and what happened, which is exactly why a gap in a matchup split is a reason to watch film rather than a conclusion about a defender.
What is absent
- Scheme. Whether the defense was in drop, switch, ICE, or a hedge is not recorded, and it usually explains more than the individual matchup does.
- Help. The second and third defenders shaping a possession leave no trace on the row.
- Shot location. Rows carry attempts and makes but not where the shots came from, which is precisely what would be needed to compare defenders fairly.
- Game state. Score margin, rest, and whether the minutes were competitive or garbage time are all outside the row.
- Intent. A switch that was planned and a blown assignment look identical here.
The third item is the load-bearing one. Without shot location there is no way to ask whether a defender conceded more than a typical defender would have on those particular shots, and that question is the whole of fair defensive comparison.
And it is sparser than it looks
In 34.2% of rows the scorer attempted no shot at all while matched against that defender. A third of the record consists of matchups where, in the only sense the data measures, essentially nothing happened.
Not every column that exists is populated either. The tracked feed loaded here carries a switch count on every row and it is zero throughout, so no switching analysis is possible from it. Checking that a field contains data before building on it is unglamorous and prevents a category of confident, empty analysis.
Using it for what it is
Matchup tracking is a good index into film and a poor substitute for it. It tells you which pairings were unusual and roughly how much evidence sits behind them. Everything about why belongs to the possessions themselves, and the data is at its most useful when treated as the thing that tells you which ones to watch.
How these figures were produced
- 24,974 rows, averaging 7.24 matchup possessions per row
- COUNT(*) and AVG(possessions) across the matchup table.
- 34.2% of rows contain no shot attempt
- Share of rows where fg_attempted = 0.
- The switch count is zero on every row
- MAX(switches) and the share of rows with switches > 0, both across all rows.
Source is NBA player-matchup tracking, 24,974 aggregated rows, last refreshed 7 June 2026. Figures describe possessions already played. Nothing here predicts a future result, and no odds, lines, or selections are published anywhere in this section.
Related research
What a matchup possession actually measures
NBA matchup possessions are partial possessions, counting only the stretch two players were matched. That is why the rates look far lower than a team offensive rating.
ReadWhich NBA scorers look most matchup-dependent
Jalen Brunson's rate ranges from 0.065 to 0.842 across nine defenders. Here is the spread for the league's most variable scorers, and how much of it is noise.
Read